SUMMARY: Just confirming that I'm not imagining things.
This isn't meant to be a downer, but just a graphic representation of the decline of the Tika/Me team in agility in the last few months.This chart shows Tika's Qualifying percentage in USDAA gamblers for the most recent 10 attempts, since she got into performance. We hung in around 50% for about a year and a half, then up to 80-90% for a year, then dropped steadily down to 20%. Haven't entered her in gamblers recently as a result.

Next up--Snooker in Performance. Why have we gone from top of the top 10 to still needing 5 Snooker Qs of ANY kind to finish our Gold PDCH? Here it is--10-attempt average is plotted, and Xs show which were SuperQs. We've dropped from about 3 years of 60% fairly steadily, to a fairly steady downhill, now running about 40%. And no SuperQs since last summer. Of course, as our Q rate has dropped, I've stopped bothering even trying to get high scores and have been trying simpler and simpler courses. That's not working so well for me, either.

Looking at Standard throughout her Performance career--hmmm, her Q rate is holding up very well indeed, even if her placement level isn't (that would be another chart); must just mostly be me being frustrated with her reluctance to go down on the table, which really eats into our yards per second. Maybe I should reconsider removing her from Standard after she finishes her 35th one, and leave her in until we actually stop Qing because of her table issue.

And then, for kicks, here's her entire lifetime 10-attempt average for Grand Prix, in both champ and performance (started Perf in May 2009); funny, I hadn't realized that we'd taken a big dip in Qing in 2010, and then went way back up and are now holding fairly steady at 60%. That's darned good, I'd say. (Again, placement average has gone down, though.)

Hmm, OK, how about Jumpers Q rates in Performance? Well, we had a really good year in 2011; slid a bit but now kinda hanging in there around 50-60%.

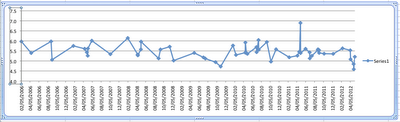
What I'm really curious about is her Yards Per Second. I have more limited data on that because I don't always get the yardage, and I don't want to count the nonqualifying runs because they might include runouts or other time-wasting things. (I could go back and use my notes to figure out the NQs that were just bars down so time wouldn't really be affected--but, really, I think I won't.) Given that, here's her entire masters/p3 jumping career in actual yards per second (moved to Perf Jumpers in October 2009).
Odd--she feels to me to be slower, but other than the last 4 times out, wow, she hasn't dropped much in speed in her whole career. That surprises me. Still--she has settled in around 5.5 yps, whereas she used to much more often get up to 6 yps. (that one 7.0ish has got to be some weird data entry or statistical error).Maybe it would be more informative as a 10-attempt average like all the preceding charts, but, hey, I think I'm done with the charts for now.
[Added next morning]--eh, just had to do the 10-run average YPS, which does a better job of showing trends. Red is average; blue is repeat of the chart above starting in 2007.]

No comments:
Post a Comment